
Key Takeaways:
- Global mobile e-commerce sales hit $4.34 trillion in 2023, with projections to surpass $7.08 trillion by 2027.
- 72% of global e-commerce sales were conducted via mobile devices in 2023, with expectations to approach 88% by 2027.
- The global CAGR (Compound Annual Growth Rate) for mobile e-commerce is expected to be 33.46% by 2027.
- 77% of U.S. online shopping traffic and 65% of U.S. online retail orders originate from mobile devices.
- 76% of U.S. adults use smartphones to shop online, and 32% do so weekly.
- Mobile phone shoppers average $103.30 per order, which is 35.1% less than the amount spent on desktops or laptops.
- 80% of shoppers used a mobile phone inside a physical store for various tasks.
- 85% of U.S. mobile shoppers prefer using apps over mobile websites.
- Over 90% of Americans either use or are open to using AR for shopping, and 98% of AR users found augmented reality to be helpful.
- The abandoned cart rate is 80.2% on mobile phones, which is 14.6% higher than on desktops.
Mobile E-Commerce Sales and Growth
Mobile e-commerce is changing the way we shop.
People are using their phones and tablets more than ever to make purchases.
Let’s take a looks at how mobile e-commerce is growing, the trends driving this change, and what we can expect in the future.
Thanks to mobile apps and mobile-friendly websites, shopping on the go has never been easier or more popular.
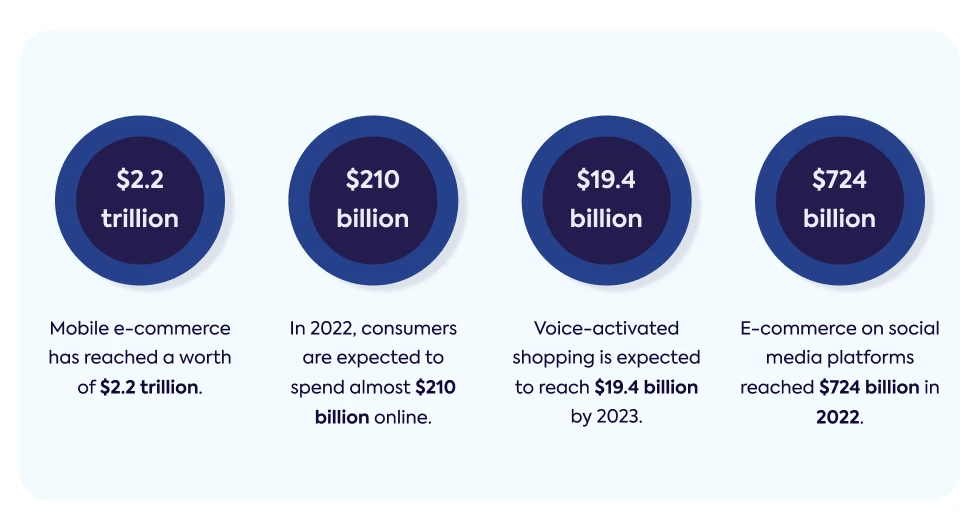
Mobile e-commerce has reached an impressive worth of $2.2 trillion.
In 2022, consumers are expected to spend almost $210 billion online.
During the 2021 holiday season, US consumers spent $17.2 billion online.
Voice-activated shopping is anticipated to surge from $5 billion in 2021 to $19.4 billion by 2023.
Commerce through social media platforms generated a substantial $724 billion in 2022.
In the US, $37 billion worth of goods and services were purchased through social commerce channels in 2021, with expectations to nearly double to $80 billion by 2025.
South Korea and China accounted for two-thirds of mobile online sales in the Asia-Pacific region in 2022.
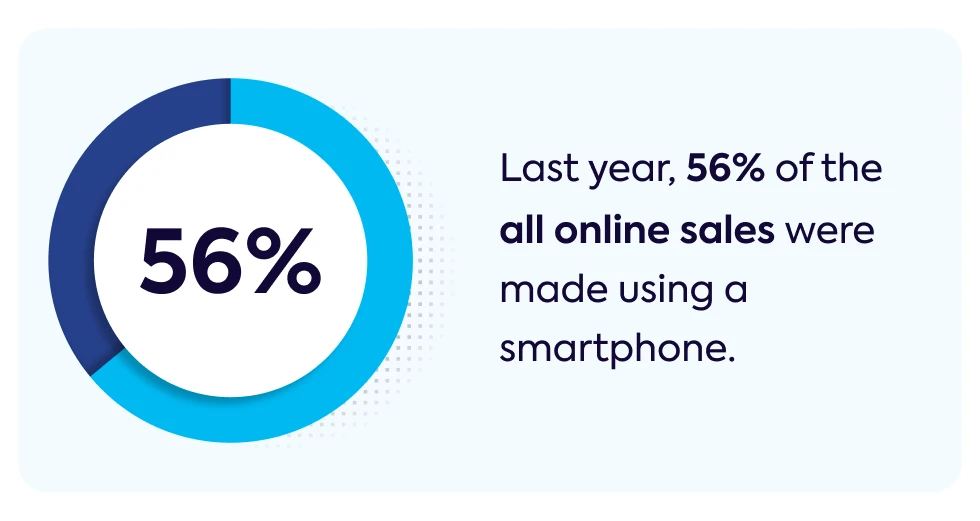
Last year, 56% of all online sales were made using a mobile device.
More than 50% of all e-commerce purchases during the 2022 holiday season were conducted via smartphones.
From 2020 to 2023, mobile e-commerce sales in the US constituted 6.11% of all retail sales.
In 2023, U.S. retail sales, both online and in-store, reached $7.243 trillion, marking a 2.08% year-over-year increase.
Global mobile e-commerce sales hit $4.34 trillion in 2023, with projections to surpass $7.08 trillion by 2027.
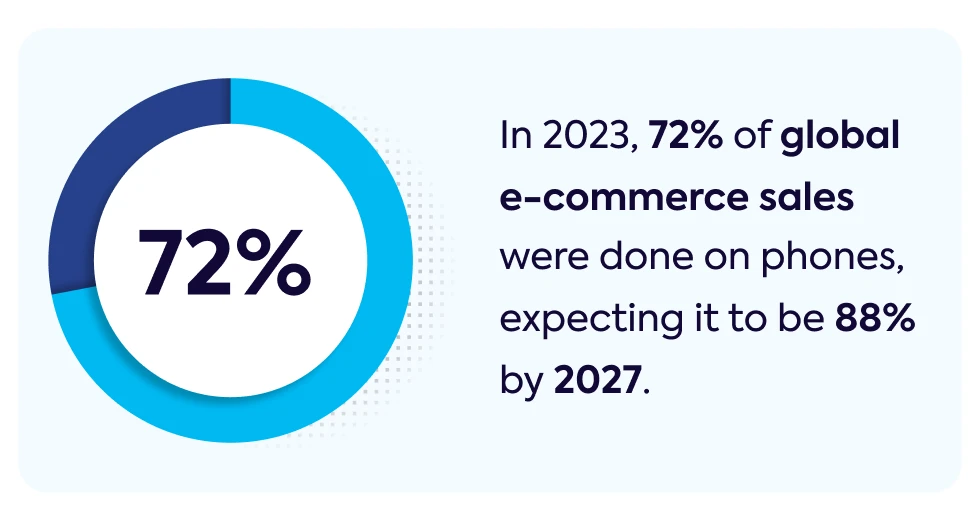
72% of global e-commerce sales were conducted via mobile devices in 2023, with expectations to approach 88% by 2027.
Mobile commerce sales are projected to grow to $604.5 billion in 2024 and $728.28 billion in 2025.
U.S. mobile retail shoppers spent $491.1 billion in 2023, reflecting a 13.8% year-over-year increase.
In 2023, U.S. mobile retail e-commerce growth exceeded global mobile retail sales growth by 2.79%.
Mobile phone shoppers average $103.30 per order, which is 35.1% less than the amount spent on desktops or laptops.
Mobile devices accounted for 8% of retail purchases in 2023, with an expectation to reach 10% by 2025.
U.S. mobile commerce is projected to constitute 8.7% of total retail sales by 2026.
As of July 2023, 60% of all global e-commerce sales were made via mobile devices.
The US market saw more than 50% increase in mobile commerce growth in 2022.
France's mobile commerce has been growing at an average rate of 28.91% over the past 11 years.
E-commerce now makes up 15% of all retail revenue.
The global CAGR for mobile e-commerce is expected to be 33.46% by 2027.
Smartphone and Mobile Usage
Smartphones have become an essential part of our daily routines.
Let’s look at how smartphones are being used today, especially for web browsing and shopping.
You'll see how mobile devices are driving online traffic and changing the way we buy things.
An estimated 15 billion mobile connected devices are currently in use globally.
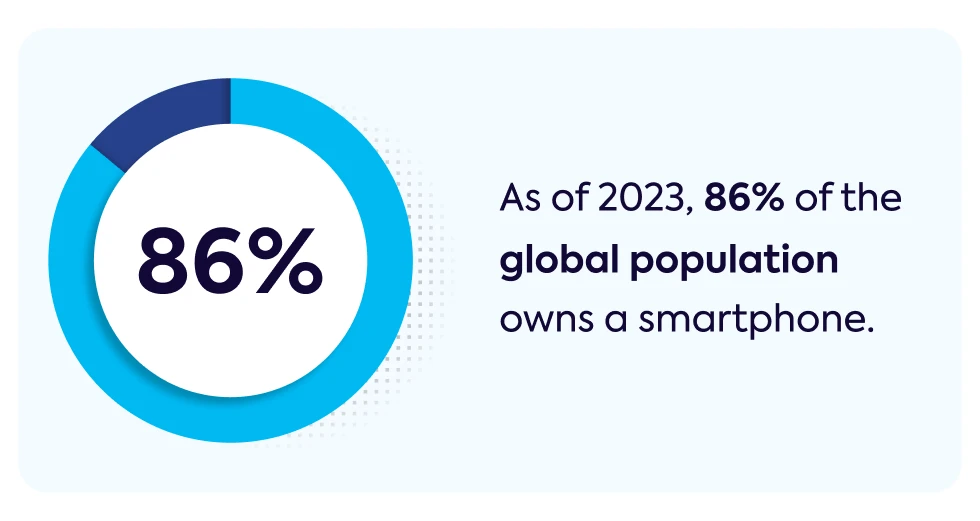
As of March 2023, 86% of the global population owns a smartphone.
Smartphone users contribute to 54.7% of global web traffic and 45.5% of U.S. web traffic.
There are 311.8 million Americans using smartphones today, with projections to reach 328.2 million by 2027.
183.2 million American adults shop via mobile devices, with numbers expected to grow to 200 million by 2027.
77% of U.S. online shopping traffic and 65% of U.S. online retail orders originate from mobile devices.
76% of U.S. adults use smartphones to shop online, and 32% do so weekly.
88% of Americans have at least one shopping app installed on their smartphones.
85% of U.S. mobile shoppers prefer using apps over mobile websites.
U.S. online shoppers are 10.1% more likely to use smartphones than desktops or laptops.
Americans are 138% more likely to shop using smartphones than tablets.
Mobile Shopping Behavior and Preferences
Most people around the world now own a smartphone, and they're using them for more than just calls and texts.
Find out how widespread mobile usage has become and its impact on web traffic and online shopping.
From browsing the internet to making purchases, smartphones are changing the way we connect and shop.
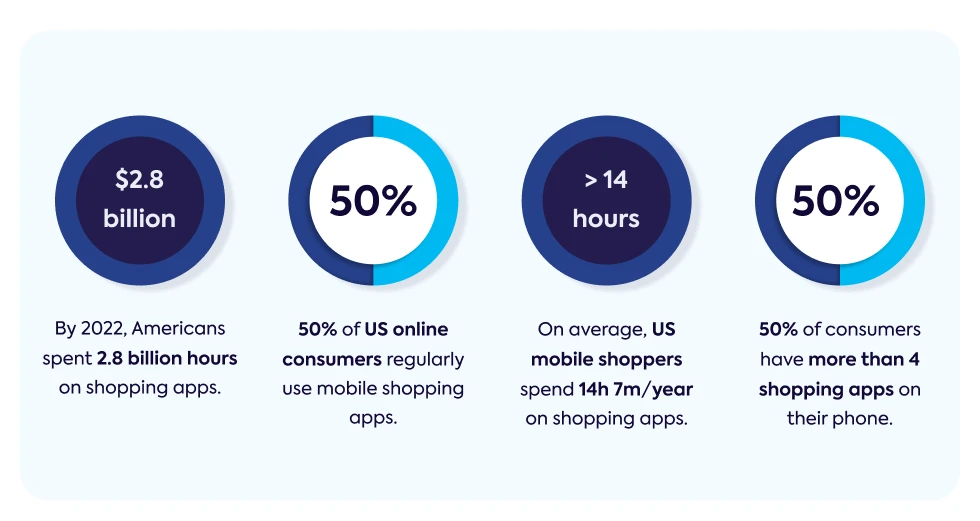
By 2022, Americans spent a staggering 2.8 billion hours on shopping apps.
On average, U.S. smartphone shoppers spend 14 hours and 7 minutes per year on mobile shopping apps.
50% of U.S. online consumers regularly use mobile shopping apps.
50% of consumers have more than four shopping apps on their phones, with 9% having over ten apps.
96% of 18- to 44-year-olds have at least one shopping app, and 61% have more than four.
Among those over 45, 75% have at least one shopping app, and 39% have more than four.
10% of regular mobile shoppers have at least five e-commerce apps on their phones.
15% of mobile shopping app users use them daily, 37% a few times a week, and 26% a few times per month.
21% of frequent mobile app users access shopping apps several times a day.
61% of American adults believe that mobile shopping is essential for online shopping convenience.
35.2% of Americans make weekly retail purchases using their smartphones.
Americans are 17.7% more likely than the global average to make weekly retail purchases via smartphone.
79% of smartphone users have made a purchase online using their mobile device in the past six months.
80% of shoppers used a mobile phone inside a physical store for various tasks.
38% of men expect their mobile shopping to increase.
Last year, 67% of online mobile shoppers were women.
51% of m-commerce customers use voice assistants for product research.
70% of online shopping is conducted through mobile phones.
In Q2 2023, 75% of retail site visits in the UK were made on smartphones.
78.9% of mobile e-commerce shoppers in the US are GenZ and Millennials.
11% of senior US shoppers aged 65+ make weekly purchases via mobile.
61% of mobile shoppers complete most of their online purchases on a desktop or laptop.
22% visit e-commerce sites after receiving brand emails or seeing social media posts.
5% browse e-commerce sites several times daily.
Mobile App Downloads and Usage
Mobile apps are everywhere these days and they’re an integral part of our shopping experience.
More and more people are using apps for their convenience and personalized features.
From augmented reality to exclusive promotions, apps offer unique benefits that enhance customer satisfaction.
Whether it's better user experiences or loyalty programs, shopping through apps is on the rise and changing retail.
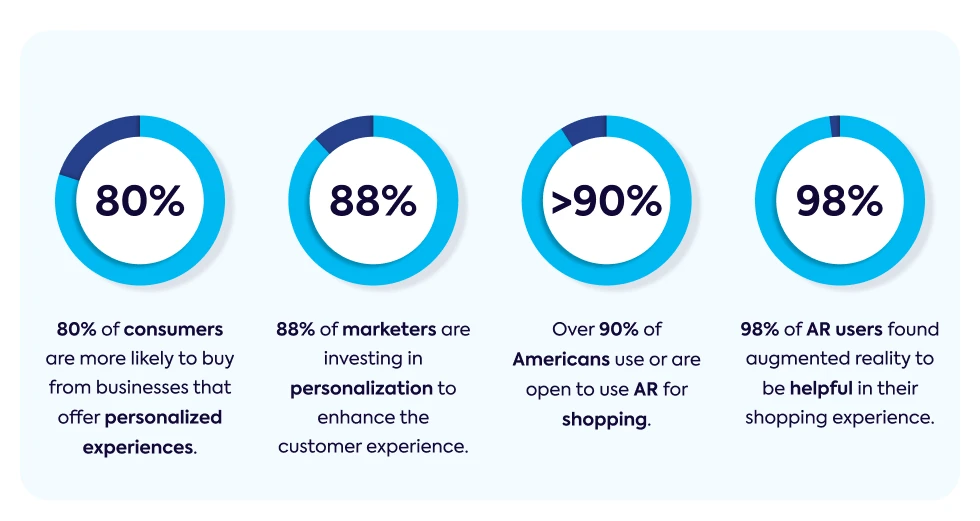
80% of consumers are more likely to purchase from businesses that offer personalized experiences.
88% of marketers are investing in personalization to enhance the customer experience.
Over 90% of Americans either use or are open to using AR for shopping.
98% of AR users found augmented reality to be helpful in their shopping experience.
In the mobile app market, China leads with an impressive 362 million downloads.
22% of people state that mobile apps provide the most convenient shopping experience.
Only 12% believe that mobile websites offer the most convenient way to shop.
31% of shoppers prefer using an app over in-store, desktop, or mobile web shopping.
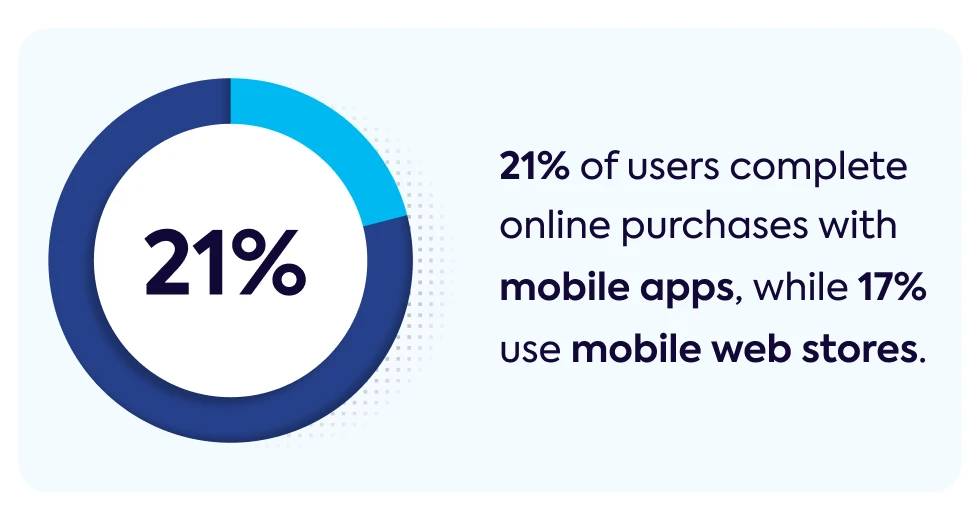
21% complete most of their e-commerce purchases through mobile apps, while 17% use mobile web stores.
11% enjoy shopping through e-commerce apps the most, which is 37.5% higher than the rate for mobile websites.
Only 8% prefer mobile websites, an 83.3% lower rate compared to computer shopping.
60% of users prefer apps for a better user experience, while 51% enjoy better promotions or discounts, and 30% appreciate exclusive products.
30% favor apps for better loyalty programs, and 23% for superior customer service.
Tablet Usage
Tablet usage for online shopping presents an interesting contrast to other mobile devices.
We’ll explore how tablets fit into the e-commerce landscape, examining user habits and spending patterns.
Despite their lower usage rates, tablets still play a unique role in how some consumers shop online.
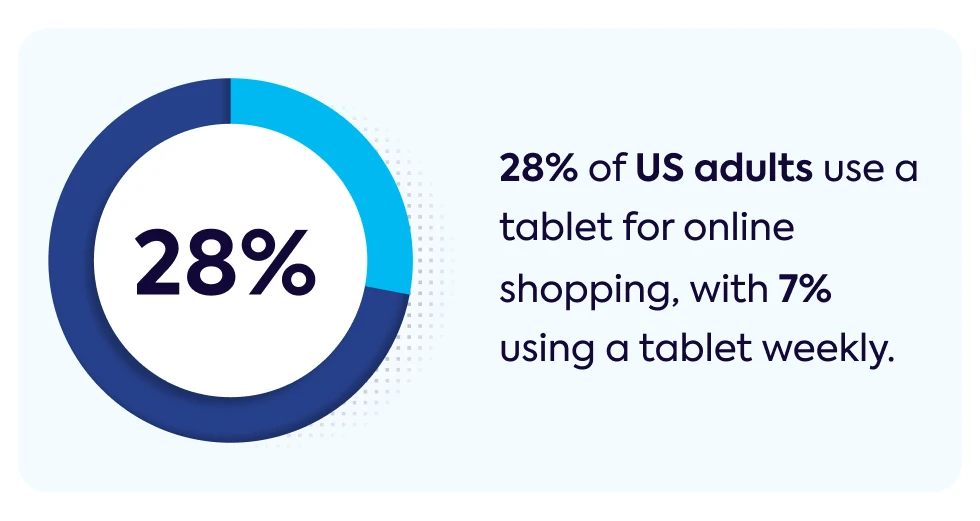
28% of U.S. adults use a tablet for online shopping, with 7% using a tablet weekly.
U.S. online shoppers are 59.4% less likely to use tablets compared to desktops or laptops.
1.28% of U.S. mobile shopping traffic and 2.99% of U.S. retail mobile orders originate from tablets.
Tablet e-commerce shoppers spend an average of $104.25 per order, which is 34.5% less than what is spent on computers.
The add-to-cart rate for tablet e-commerce stands at 11.7%, which is 21.9% higher than on desktops.
Tablet users view an average of 6.1 pages, which is 14.9% more than on desktops.
Mobile Commerce Conversion Rates
Mobile commerce conversion rates tell us how often browsing turns into buying.
While more people shop on their phones, converting those visits into sales can be tricky.
Some of the statistical points worth noting are the rates at which mobile shoppers complete their purchases, how these rates compare across devices, and what factors might be influencing these trends.
It goes without saying, the conversion rates are key to improving the mobile shopping experience and boosting sales.
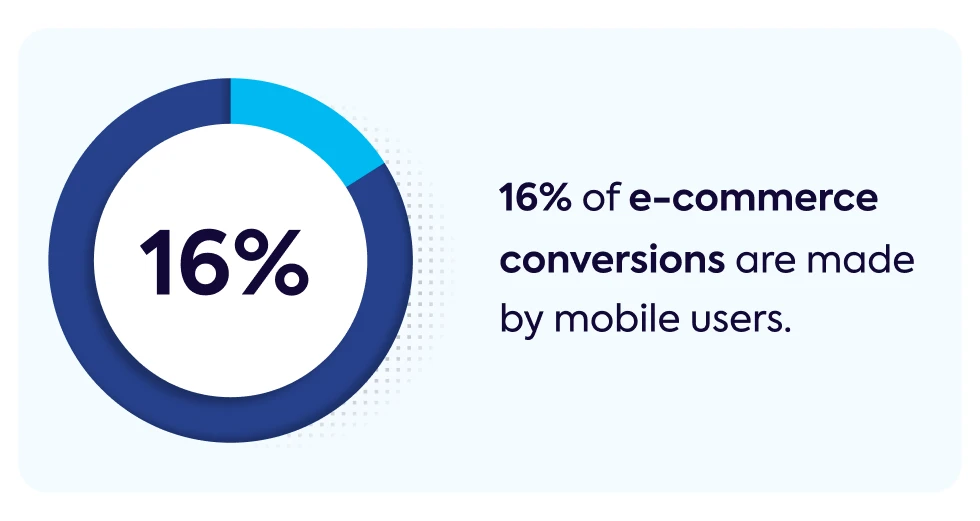
16% of e-commerce conversions are attributed to mobile shoppers.
The average e-commerce conversion rate on mobile phones stands at 2.3%, which is 17.9% lower than the rate on desktops.
On tablets, the conversion rate is 3.1%, making it 10.7% higher than on computers.
The add-to-cart rate for smartphone e-commerce is 12.2%, which is 27.1% higher than on desktops.
Abandoned cart rates are 80.2% on mobile phones, 14.6% higher than on desktops, and 72.3% on tablets, 3.29% higher than on desktops.
Global Mobile Shopping Statistics
People around the world are glued to their phones, and shopping is a big part of that.
Whether it’s checking out retailer websites or using apps in stores, mobile shopping is huge.
Let's take a look at how this trend is playing out globally and see which countries are leading the charge.
In 2022, shoppers globally spent a remarkable 108 billion hours on shopping apps, marking a 9.1% year-over-year increase.
80% of global consumers visit retailer websites on smartphones while in-store, and 74% use retailer apps during their in-store shopping experience.
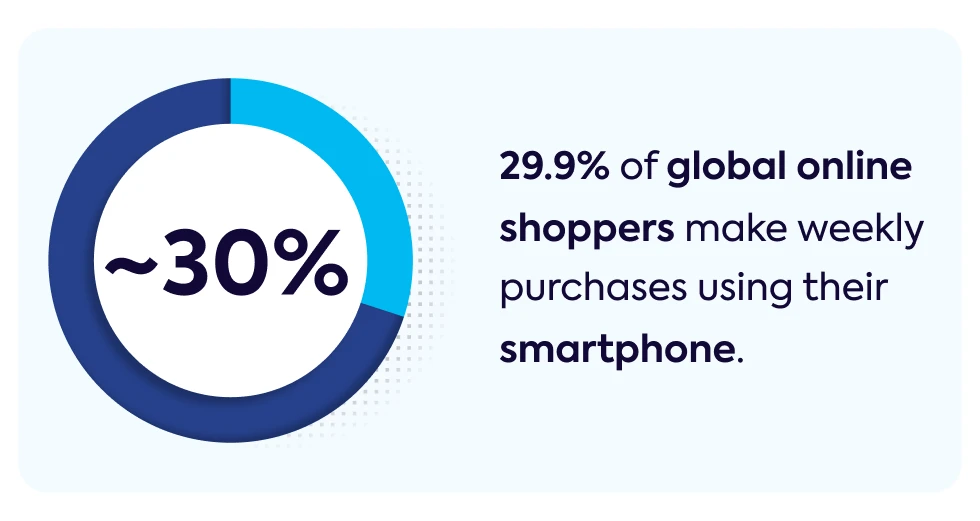
29.9% of global online shoppers make weekly purchases using their smartphones.
Among South Korean internet users, 44.4% make weekly smartphone purchases, which is 48.5% more likely than the global average.
In Mexico, 35.3% of internet users make weekly mobile e-commerce purchases, a rate 18.1% higher than the global average.
In China, 33.7% of internet users make weekly mobile e-commerce purchases, which is 12.7% higher than the global average.
32.5% of UK internet users engage in weekly mobile e-commerce purchases, 8.7% higher than the global average.
For Canadian internet users, 29.7% make weekly mobile e-commerce purchases, just 0.67% lower than the global average.
In Japan, 21.3% of internet users make weekly e-commerce purchases, which is 28.8% lower than the global average.
Among those aged 30-49, a striking 92% regularly use smartphones for online shopping, with 49% shopping weekly.
Most Popular Shopping Apps in the U.S. on Apple devices
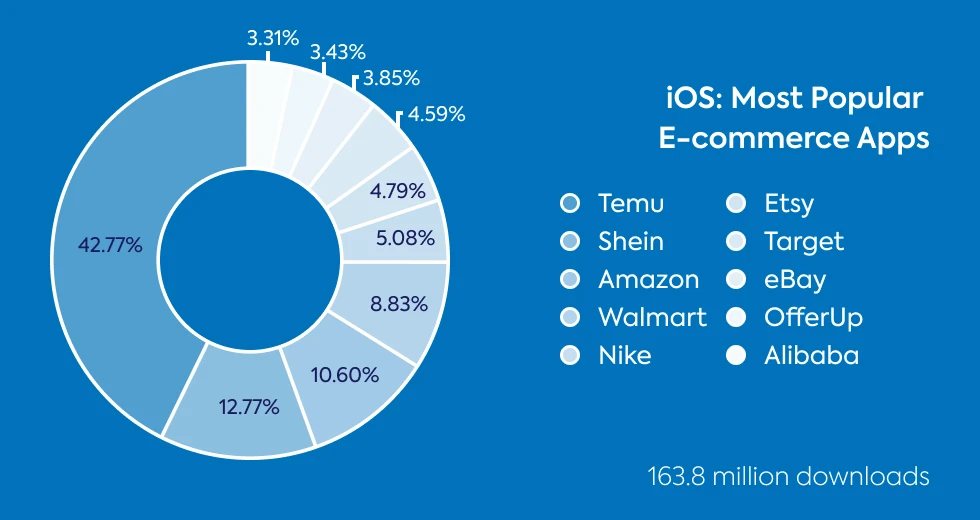
Temu 52.44mil, Shein 15.59mil, Walmart 8.26mil, Amazon 6.44mil, Alibaba 3,76mil, OfferUp 3.62mil, Etsy 3.60mil, eBay 3.22mil, Nike 3.12mil, and Target 3.08mil downloads.
Most Popular Shopping Apps in the U.S. on Android devices
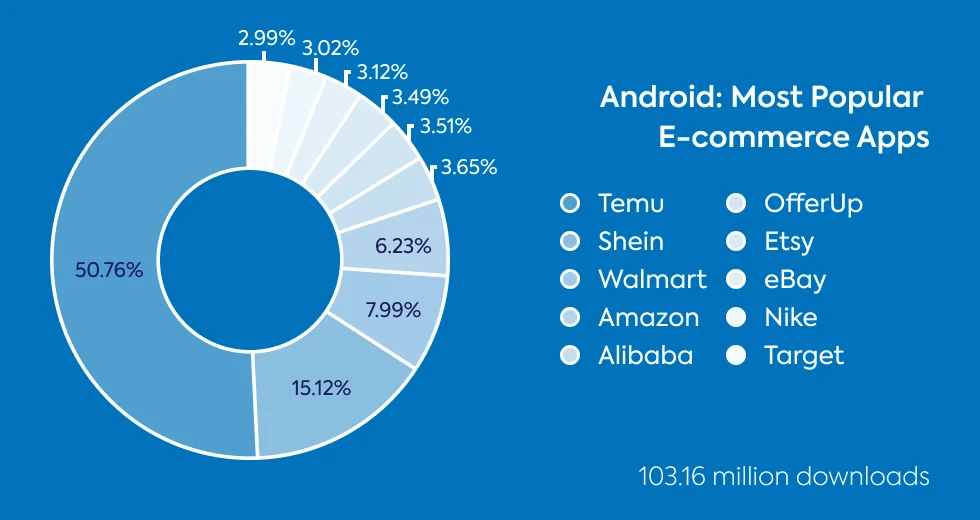
Temu 70.06mil, Shein 20.92mil, Amazon 17.37mil, Walmart 14.46mil, Nike 8.32mil, Target 7.84mil, Etsy 7.51mil, eBay 6.31mil, OfferUp 5.62mil, and Alibaba 5.43mil downloads.
Mobile Payment Methods
Mobile payment methods are gaining traction among U.S. adults, with a significant number opting for the convenience of digital wallets.
Services like PayPal, Apple Pay, and Venmo are leading the way, showing a clear preference for streamlined, secure online transactions.
31% of U.S. adults have utilized mobile payment methods for online shopping.
Among adults who favor online shopping, 45% have used mobile payment methods.
36% of mobile wallet users have relied on PayPal for their online purchases.
18% of mobile wallet users opt for Apple Pay, 15% use Venmo, 9% prefer Google Wallet, and 5% choose Samsung Pay.
Sources
Statista, Practical Ecommerce, Zippia, Technology Signals, Influencer Marketing Hub, TechTarget, McKinsey, Oberlo, ZDNet, Semrush, eMarketer, Monetate, and NewStore.